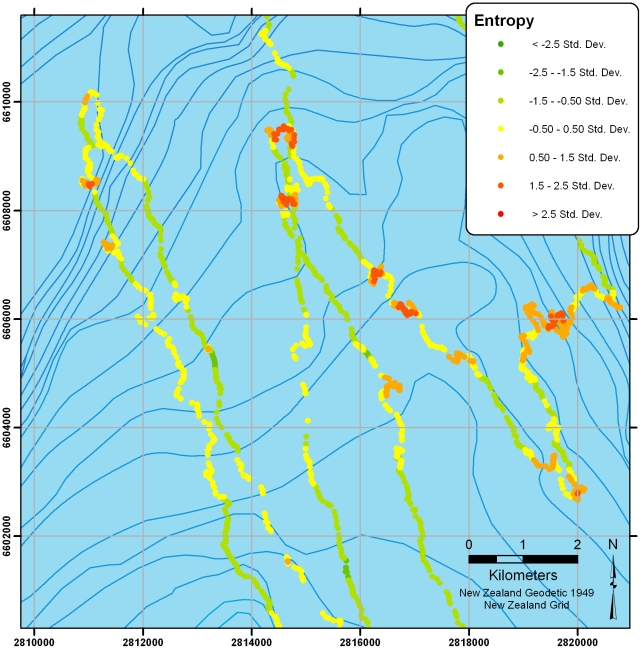
Figure 9. Zoomed section from figure 8 showing a high-resolution track overlaid with spatio-temporal uncertainty (entropy) calculated at each location.
Colours are categorised according to the distribution of entropy along the track and show regions of high-predictability (low-entropy) in green contrasting with sections of highly unpredictable movement (high-entropy) in red.

