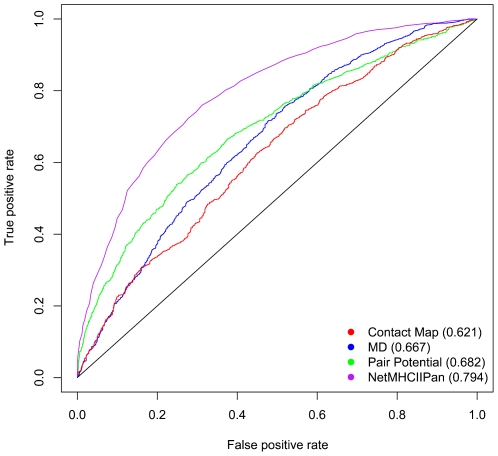
Figure 4. Performance of three ab initio structure based prediction methods and NetMHCIIpan using HLA DRB1*0101 as an example.
The prediction results of three methods applied to HLA DRB1*0101 binding data are shown in the ROC plot. The ROC curves were generated by plotting the true positive rate (y-axis) against the false positive rate (x-axis). The AUC values for the three methods were shown in parentheses.

