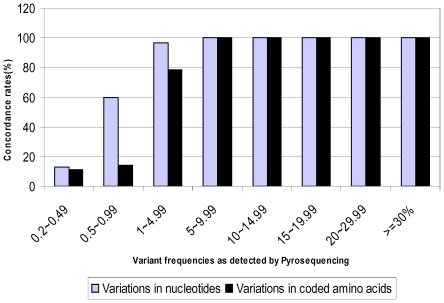
Figure 1. Concordance of variations detection by pyrosequencing and Sanger sequencing.
The concordance rates were calculated as percentage of pyrosequencing detected sequence variations that were also observed in Sanger sequencing. Frequency ranges are categorized based on those detected by pyrosequencing.

