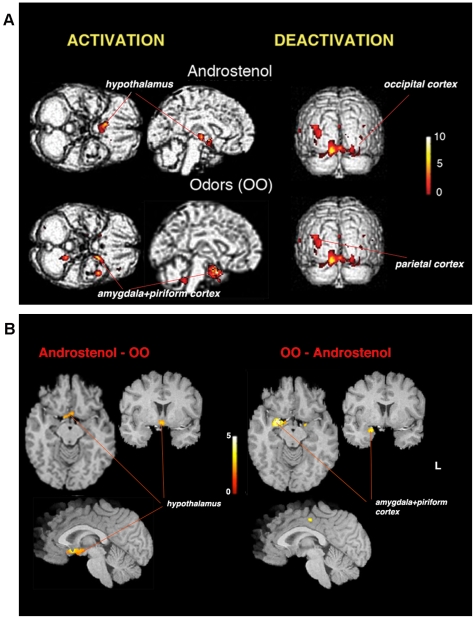
Figure 1. Activations and deactivations with androstenol and OO.
Upper: Activation and deactivation with Androstenol and OO. Activation (left) and deactivation (right) detected during smelling of Androstenol, and odors (OO). The OO cluster is located in the amygdala and piriform cortex. Lower: Difference between activations with Androstenol and odors (OO). The Frontal lobe clusters in the Androstenol – OO contrast were not significant. Clusters calculated at P = 0.01, corrected P<0.05 are superimposed on the standard brain MRI. The Sokoloff's color scale illustrates T values reflecting the degree of activation.

