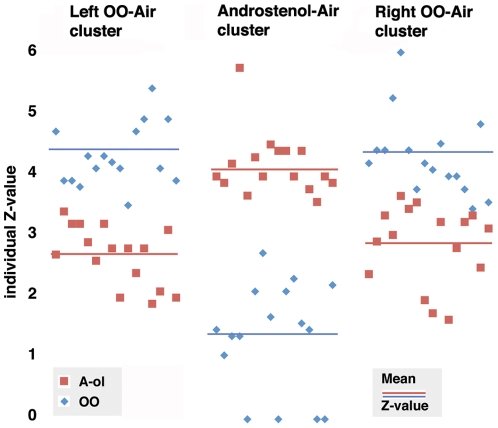
Figure 2. Individual Z-values in the activated clusters.
Graphical presentation of individual Z-values from Talairach's co-ordinate 4 0 -18 (peak activation in the hypothalamus cluster derived from Androstenol – Air, and the Talairach's coordinates 18 -10 -4 and -22 2 -8 (peak activations in the right and left amygdala+piriform cortex clusters derived from OO - Air. The individual values were obtained from the respective peak co-ordinate by lowering the uncorrected threshold to P = 0.1, which allowed retrieval of the respective Z-values although they were far below the significance level for the respective contrast (P = 0.01, corrected p<0.05, please see the main text). The figure illustrates that that the hypothalamus networks were recruited during smelling of Androstenol, but not OO. Vertical line indicates Z-values, horizontal line the individual subjects).

