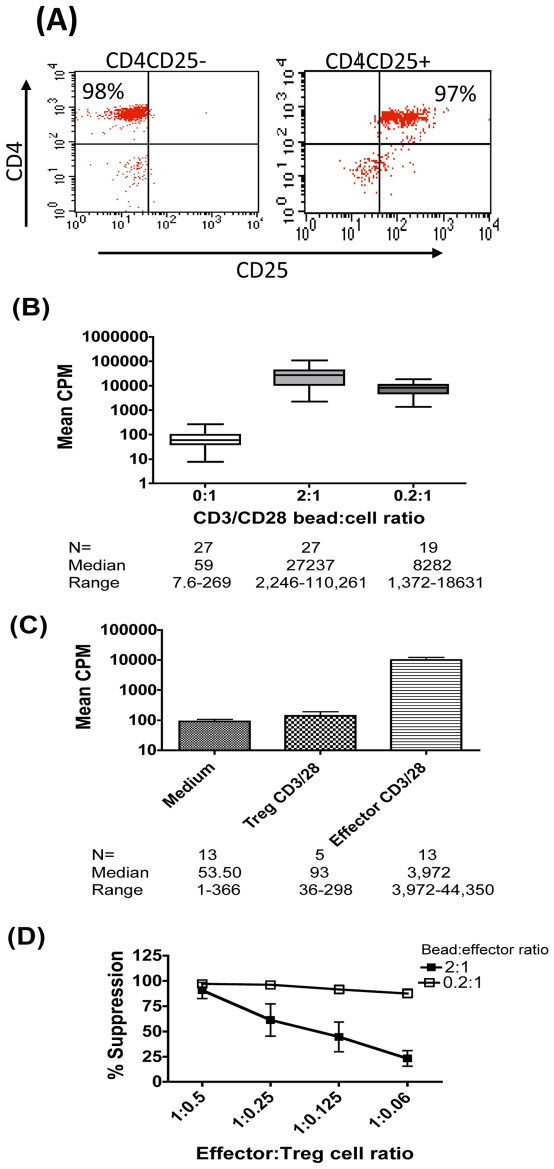
Figure 1. Potency of Treg-suppression is dependent on strength of stimulus and on Effector∶Treg cell (E∶T) ratio.
(A) Typical FACS plot displaying purity of effector (CD4+CD25−) and Treg (CD4+CD25+) populations in healthy control subjects. (B) Mean counts per minute (CPM) (+SEM) uptake of tritiated thymidine in CD25− effector T cells from healthy controls (N = 27) stimulated with mitogenic CD3/28 beads at 2∶1 and 0.2∶1 bead: cell ratios. (C) Mean CPM (+SEM) in CD25− effectors v CD25+ Treg cells stimulated with mitogenic CD3/28 beads at 2∶1 bead: cell ratio. (D) Mean (+SEM) percentage suppression of effector cell proliferation following activation with CD3/28 beads at 2∶1 (closed boxes) and 0.2∶1 (open boxes) bead: cell ratios.

