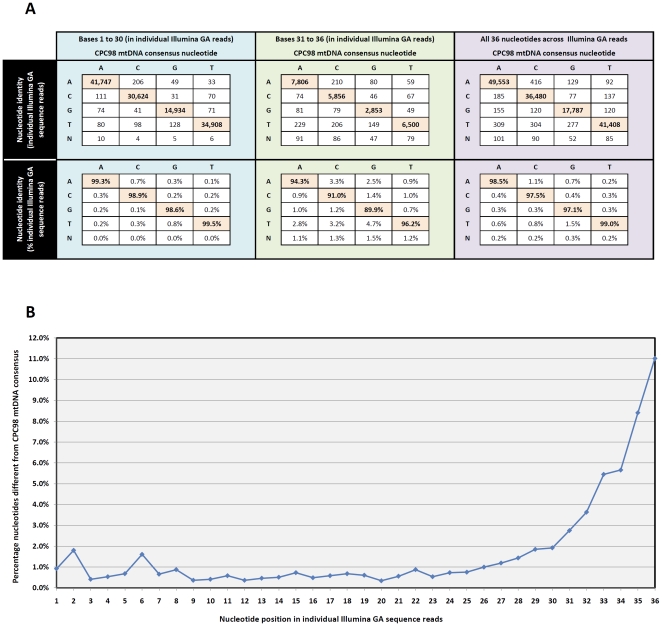
Figure 1. The identity and distribution of DNA nucleotide mismatches in individual Illumina GA reads compared to the CPC98 consensus mtDNA genome.
(A) The number and proportion of each nucleotide called in the Illumina GA reads (vertical column) compared to the consensus mtDNA sequence (horizontal column) is presented. (B) Mean percentage of discordant nucleotides for each position across all individual Illumina GA sequence reads.

