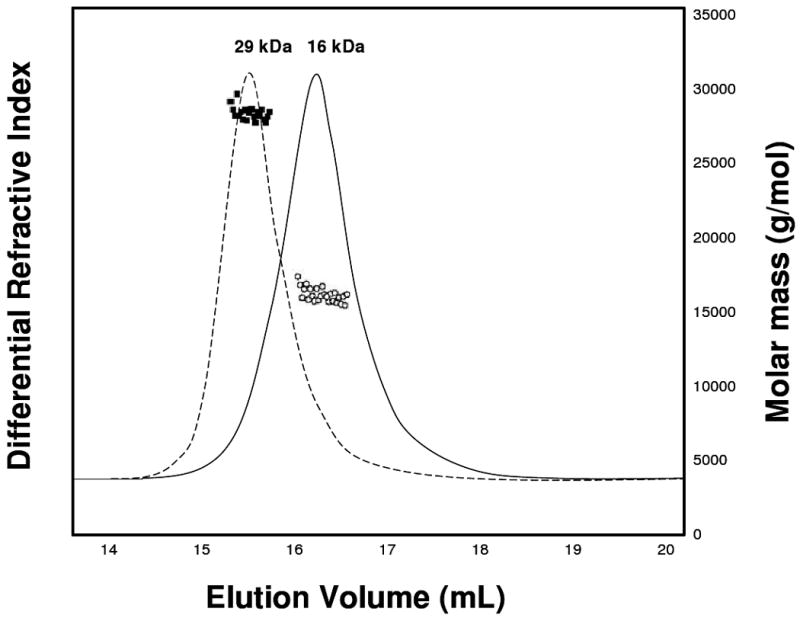
Figure 4.

SEC-MALS analysis of AtraPBP1 at pH 4.5 (solid) and pH 7.0 (dashed). The molar masses of AtraPBP1 in solution at pH 4.5 (circles) and pH 7.0 (squares) were calculated from a Zimm plot analysis of the observed light scattering intensity using a refractive index increment, dn/dc = 0.185 L g-1 (17, 18). Protein concentrations are at 500 μM.
