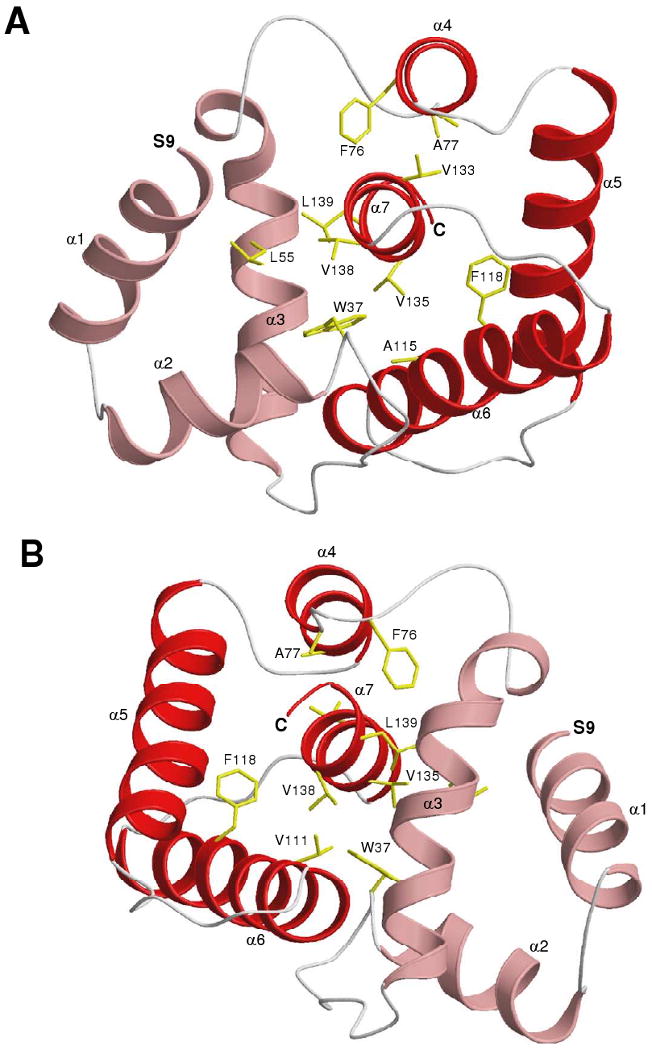
Figure 5.

NMR-derived structures of AtraPBP1 in solution at pH 4.5 determined by NMR. (A) Ribbon representation of the energy-minimized average main chain structure. (B) ∼180° rotation of A. The N-terminal residues (1-8) are unstructured and not shown. α-helices are highlighted red and light-red, and hydrophobic side chains are yellow.
