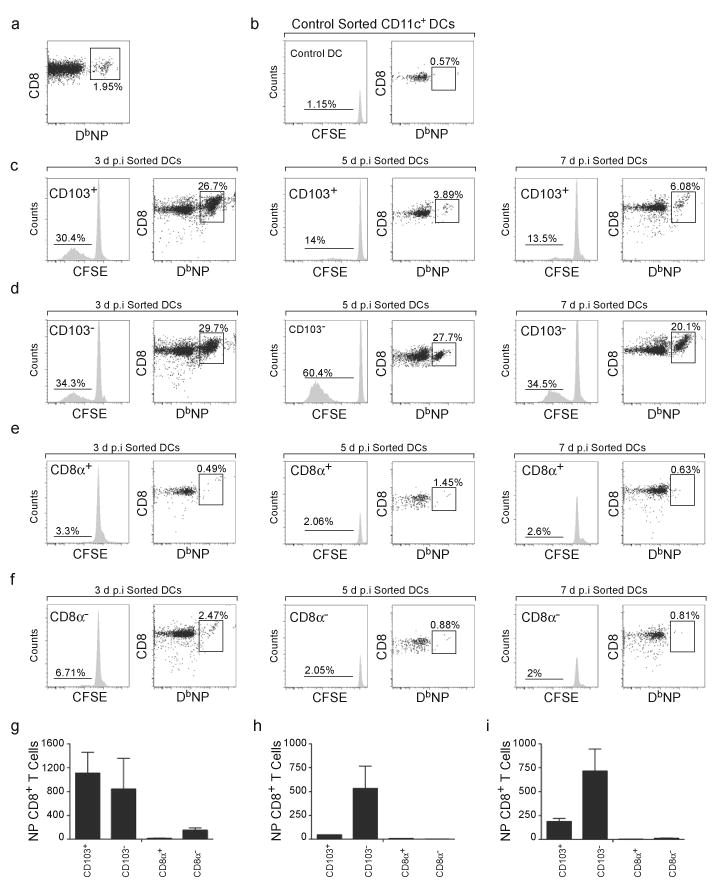
Figure 5. CD103−CD11bhi tDCs continue to present antigen at late times after infection.

(a) C57BL/6 mice were infected with PR8 and CD8+ T cells were purified from draining mLNs 7 days later. The frequency of NP-specific CD8+ T cells in the purified population was evaluated by flow cytometry. (b) Purified CD8+ T cells from panel a were labeled with CFSE and co-cultured with CD11c+ DCs from the spleens of uninfected mice. The frequency of NP-specific CD8+ T cells that had divided (histogram) and frequency of NP-specific CD8+ T cells in the total CD8+ T cell population (dot plot) were evaluated by flow cytometry after 3 days of culture.(c–f) Purified CD8+ T cells from panel a were labeled with CFSE and co-cultured with CD103+CD11blo tDCs (c), CD103−CD11bhi tDCs (d), CD8α+ cDCs (e) and CD8α−cDCs (f) that were sorted from the mLNs of mice that had been infected with PR8 3, 5 or 7 days previously. The frequency of NP-specific CD8+ T cells that had divided (histogram) and frequency of NP-specific CD8+ T cells in the total CD8+ T cell population (dot plot) were evaluated by flow cytometry after 3 days of culture. (g–i) The number (mean ± SD) of proliferating CFSElo NP-specific CD8+ T cells was calculated for cultures initiated with day 3 DCs (g), day 5 DCs (h) and day 7 DCs (i). All values were obtained in triplicate. The results in panels a-i are representative of three independent experiments.
