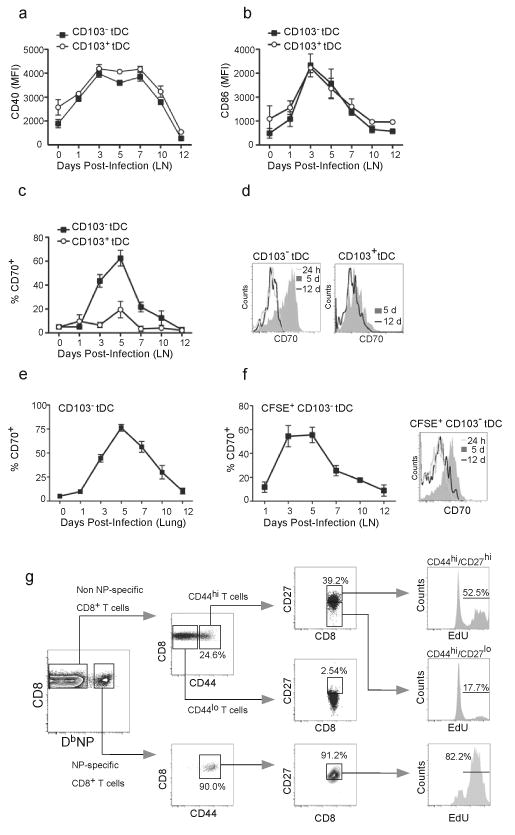
Figure 7. CD70 expression is a hallmark of CD103−CD11bhi tDCs.

(a–c) C57BL/6 mice were infected intranasally with PR8 and the expression of CD40 (a), CD86 (b) and CD70 (c) on CD103+CD11blo and CD103−CD11bhi tDCs was determined by flow cytometry. Values represent the mean ± SD of the mean fluorescence intensity (MFI) or percentage of positive cells (n = 4–5 mice/time point). Data are representative of three independent experiments. (d) C57BL/6 mice were infected intranasally with PR8 and the expression of CD70 on CD103+CD11blo and CD103−CD11bhi tDCs in the mLNs was compared by flow cytometry at 24 h, 5 days and 12 days after infection. Data are representative of three independent experiments. (e) C57BL/6 mice were infected intranasally with PR8 and the frequency of CD70-expressing CD103−CD11bhi tDCs in the lungs was determined by flow cytometry. Data are representative of three independent experiments. (f) C57BL/6 mice were infected intranasally with PR8 and 16 h prior to sacrifice, cells in the lung were labeled with CFSE by intranasal instillation. The frequency of CD70-expressing, CFSE-labeled CD103−CD11bhi cells in the mLNs was determined by flow cytometry at the indicated times. Values represent the percentage (mean ± SD) of CD70-expressing, CFSE-labeled, CD103−CD11bhi cells calculated for each time point (n = 4–5 mice / time point). Data are representative of three independent experiments. (g) C57BL/6 mice were infected intranasally with PR8 and injected with EdU 3 times, 6 h apart on day 6 after infection. The frequency of EdU-labeled cells in various CD8+ T cell subsets in the mLN was determined by flow cytometry 24 h after the first EdU injection. Plots are representative of two independent experiments (n = 5).
