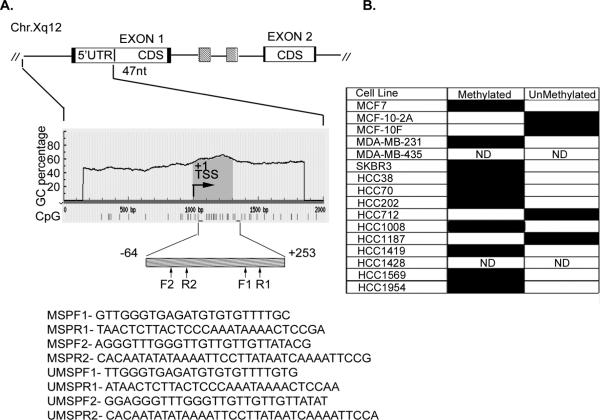
Figure 2. Methylation status of XEDAR in human breast cancer cell lines.
A. A schematic representation of the 5' region of human XEDAR gene, the grey box below indicates the position of CpG rich region. The positions of primers to study the methylation status are indicated. TSS, transcription start site. B. The DNA was extracted from cell lines and tissue specimens after bisufite modification as explained in Material and Methods. The modified DNA was used to run qMSP (qRT-methylation specific real-time PCR) using methylation-specific and unmethylation-specific primers. A representative pattern of hypermethylation status of various cell lines is presented here. The closed box represent positive PCR while open box represent negative reaction; ND, Not determined.

