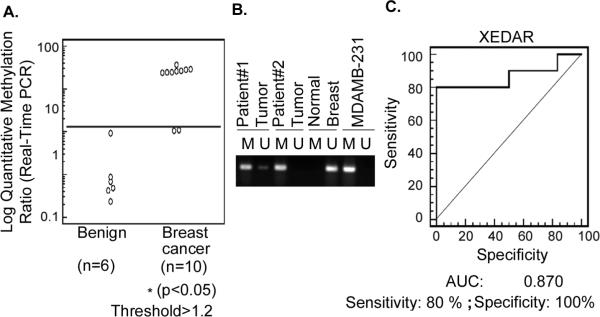
Figure 3. Methylation status of XEDAR promoter in normal breast and breast tumor samples.
A. Methylation level of XEDAR in normal breast and breast tumor samples was quantified by qMSP as described in Material and Methods. Quantitative ratio is defined as the ratio of fluorescence for PCR product of XEDAR to those of PCR products of MyoD1. Solid horizontal bar indicates the threshold above which samples are considered positive for methylation. A significant increase in the level of methylation was observed in the breast cancer as compared to normal breast tissue samples (*P<0.05; Mann-Whitney U test). B. Representative methylation-specific real-time PCR results from three sets of patient samples, two from breast tumors (patient number 1 and 2) and one from normal breast tissue. M, PCR product amplified using primers specific for methylated DNA; U, PCR products amplified using primers specific for unmethylated DNA. The DNA from MDAMB-231 was used as control to detect methylated gene. C. A receiver operating characteristic curve (ROC) for XEDAR was generated for separating breast cancer from normal breast tissue samples using MedCalc software. ROC curve is a plot of true positive rate vs. false positive rate for different possible cutoff points of a test. The area under curve (AUC) signifies the accuracy of test. AUC for XEDAR was observed to be 0.870 with 100% specificity and 80% sensitivity.

