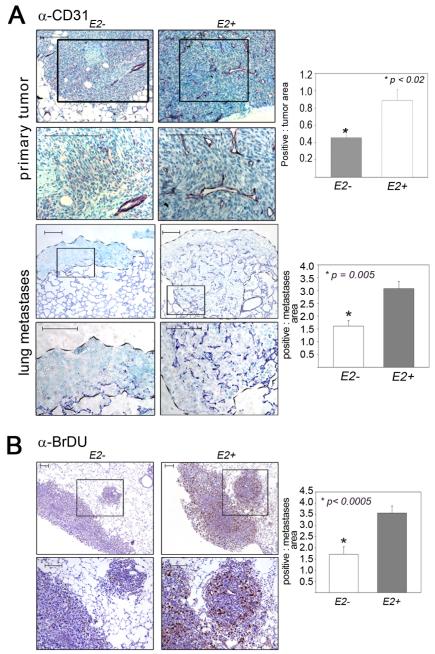
Figure 5. Impaired tumor angiogenesis and proliferation with Ets2 deletion in TAMs.
A - Images of mammary (top two panels) and lung (bottom two panels) sections from mice injected with the MVT-1 and Met-1 cells respectively; genotypes as indicated. Immunostainedwith α-CD31. B-Micrographs of lung sections from mice injected with the Met-1 cell line in the indicated genotypes, immunostained with α-BrDU. Panels 2 and 4 in A and bottom panel in B represent high magnification image of areas demarcated by the box in the respective top panels. Scale Bar = 100μm. Quantification of antibody staining is presented as the average area of staining per tumor area (graphs at right of each panel). Five different tumor areas from five different mice in each group were analyzed. Statistical significance (p-value evaluated by unpaired Student’s t-test) is shown.

