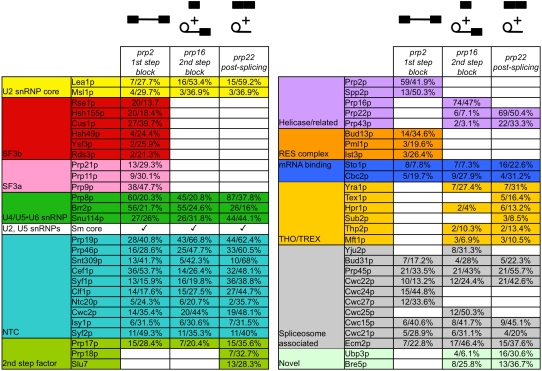
FIGURE 2.
Mass spectrometry analysis of the associated proteins from first step-arrested, second step-arrested, and post-second step spliceosomes. Polypeptides corresponding to peak fractions from Figure 1C (prp2-arrested first step), Figure 5B (prp16-arrested second step), from Figure 5E (prp22-arrested spliceosomes) were analyzed by MudPIT. Proteins are categorized by group or functional association. Data for the number of peptides identified and percentage polypeptide sequenced are shown. Polypeptide contaminants are listed in Supplemental Table S1.

