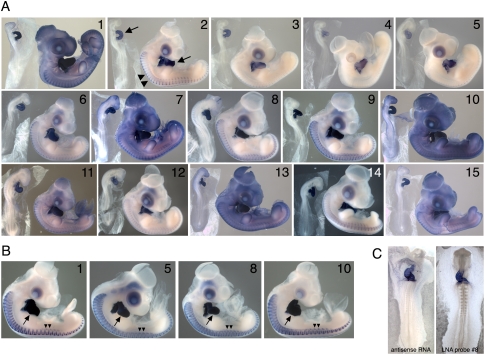
FIGURE 2.
(A) ISH patterns for each of the 15 LNA probes shown in Figure 1A. Hybridization was carried out at 22°C below the predicted Tm for each probe. Washing and staining times were the same for all probes. For each probe, a stage 14 and stage 22–24 embryo is shown. (B) Expression patterns obtained using the indicated LNA probes when washing and staining was optimized for each probe. Arrows indicate the heart; double arrowheads point to staining within the skeletal muscle cells of the somites. (C) Comparison of hybridization signal obtained with a 1.17-kb cTNT antisense probe versus cTNT LNA probe 8.

