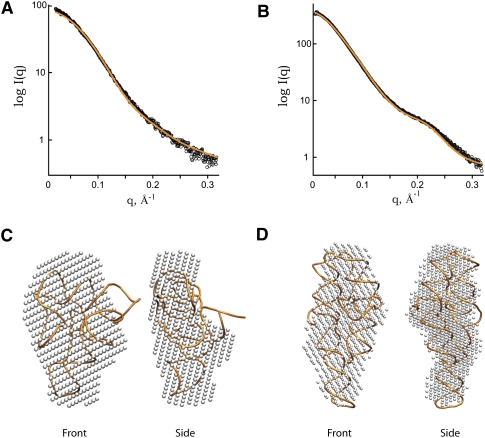
FIGURE 3.
SAXS data and models from SEC purified refolded SAM-I and P4-P6 domain. Experimental SAXS profiles of purified SAM-plus (A) and P4-P6 domain (B). In both cases, the orange curve represents the theoretical SAXS profile calculated from X-ray crystal structures of SAM-I (PDB: 2GIS) and P4-P6 domain (PDB: 1L8V). DAMMIN/F ab initio models in two orientations calculated from the SEC purified SAXS data SAM-I RNA (C) and P4-P6 domain (D). Orange backbone models represent the X-ray crystal structures for SAM-I and P4-P6 domain superposed with the program SUPCOMB.

