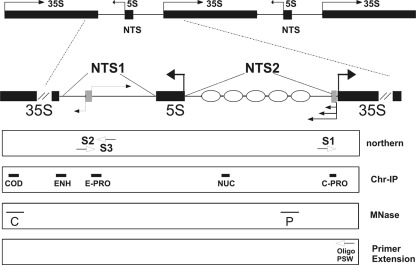
Fig. 1.
Map of rDNA, probes, and oligonucleotides used in this study. Schematic map of ribosomal genes in Saccharomyces cerevisiae. Horizontal black arrows represent RNA transcripts. Filled boxes indicate 35S and 5S coding units. Gray boxes represent ncRNA promoters. Ellipses refer to positioned nucleosomes. The boxed areas in the lower part of the figure contain probes used in Southern and Northern blotting experiments (thin horizontal black lines). White arrows indicate oligonucleotides used in RT-PCR and primer extension experiments. The thick black lines represent the positions of amplicons produced in Chr-IP analyses.

