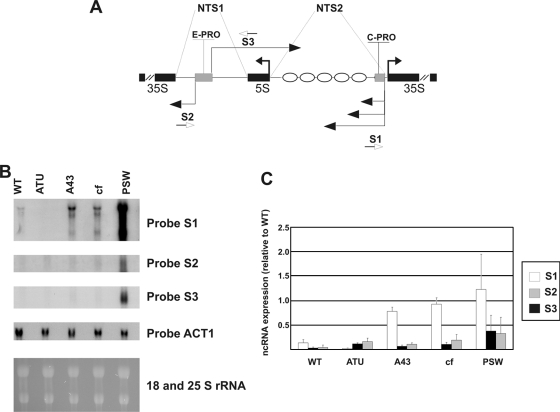
Fig. 2.
Pol II-produced ncRNAs are overexpressed in different mutants for Pol I transcription. (A) Schematic map showing ncRNA positions (horizontal thin black arrows), rRNA (horizontal thick black arrows), ncRNA promoters E-PRO and C-PRO (gray boxes), and positioned nucleosomes (ellipses). (B) Northern analysis showing ncRNAs from the strains specified at the top of the gel. Total RNA (20 μg) from each mutant resolved in a 1.2% agarose gel is visualized with the different probes indicated at the right side of the panel. 18S and 25S RNAs in the lower part of the figure show loading control and RNA integrity. (C) ncRNA quantification in the specific strains. S1, S2, and S3 represent different single-stranded probes showing the three main ncRNAs. The band intensities were measured by phosphorimaging and normalized to the ACT1 value. In the graph the ncRNA values are given relative to the rDNA copy number.

