Fig. 6.
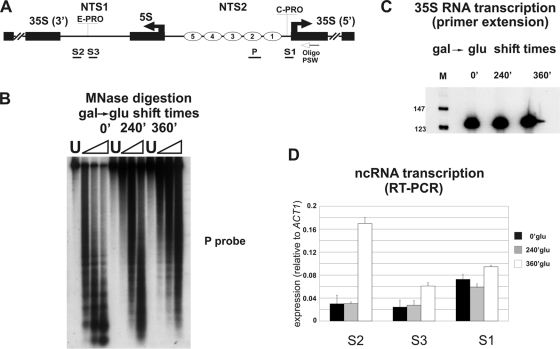
Chromatin dissolution affects ncRNA production at the rDNA locus. (A) Schematic map of the analyzed region. (B) UKY cells were treated for chromatin spacing analysis with increasing amounts of MNase (triangles) at the specified times of glucose repression of the H4 gene. U, untreated DNA. The digested DNAs were separated on a 1.2% agarose gel and subjected to Southern blotting. The resulting filter was hybridized to P probe. (C) Primer extension analysis at the specified times of glucose repression of the H4 gene. M, molecular weight marker. The oligonucleotide PSW was utilized as a primer. (D) RT-PCR results of cDNA obtained from RNA extracted at the specified times of glucose repression of the H4 gene. S1 to S3 oligonucleotides were used as primers. Different columns in the histogram refer to the specified times of glucose repression of the H4 gene. The band intensities were measured by phosphorimaging and normalized to the ACT1 value.

