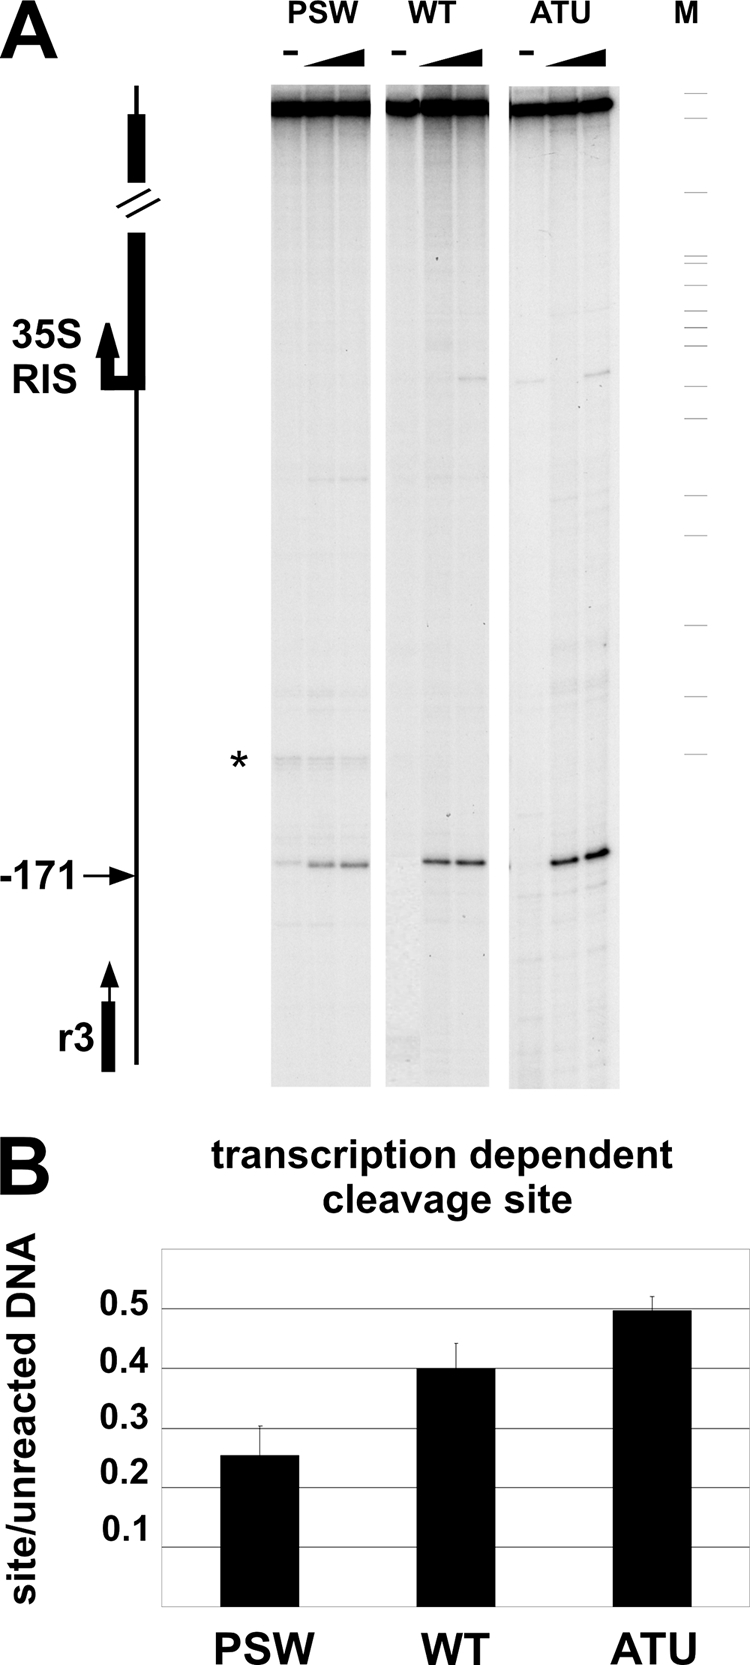
Fig. 7.

In vivo DNA topoisomerase I cleavage efficiency depends on Pol I activity. (A) Spheroplasts from WT, PSW, or ATU cells were treated with 50 and 100 μM CPT (triangles); − indicates unreacted material. M, molecular weight marker (pBR322 MspI). The fragments resulting from DNA topoisomerase I activity were primer extended from oligonucleotide R3 (vertical black arrow) annealing at position −268 bp from the 35S RNA start. The horizontal black arrow indicates the DNA topoisomerase I cleavage site; the star indicates a pausing site of Vent polymerase. On the left of the figure a representation of the analyzed region is shown. (B) Quantification of the DNA topoisomerase I cleavage activity at position −171 bp. The intensity of the cleavage site (50 μM CPT) was normalized to the unreacted material and reported as a histogram bar for each strain analyzed. Standard deviations are reported.
