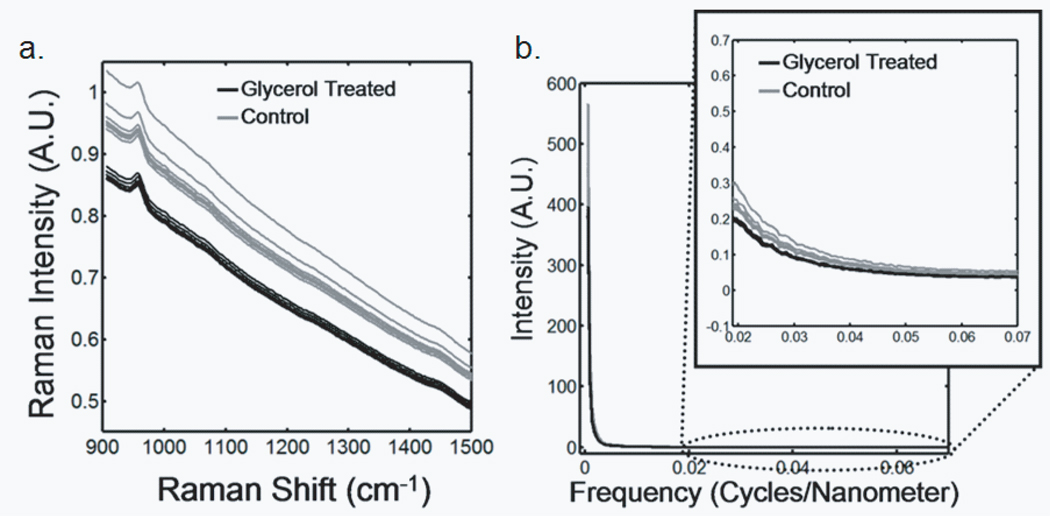
Fig. 2.
Raman spectra of a murine tibia (distal diaphysis). The bone tissue is approximately 1 mm below the skin. The gray traces are raw spectra obtained without optical clearing, and the black traces are spectra obtained after glycerol application (a) Transcutaneous Raman spectra (b) Power spectra

