
Figure 3.
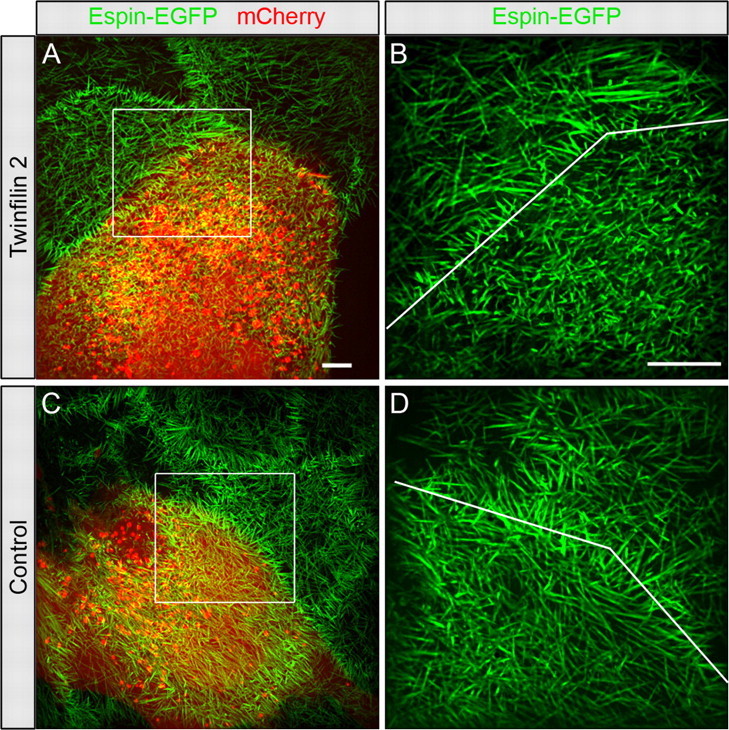
Twinfilin 2 transfection of CL4 cells. A, CL4 cells stably expressing GFP-espin (green) were transfected with a vector containing twinfilin 2 IRES mCherry. Red identifies mCherry expression. B, Higher magnification of the area indicated with the white box in A with the line pointing out the border between the transfected and untransfected cells. C, D, Microvilli length changes of control transfected cells in comparison with neighboring untransfected cells. Microvilli lengths of control-transfected cells expressing mCherry only (red) are not significantly different from the neighboring cells. Scale bars: A (for A, C), B (for B, D), 5 μm.