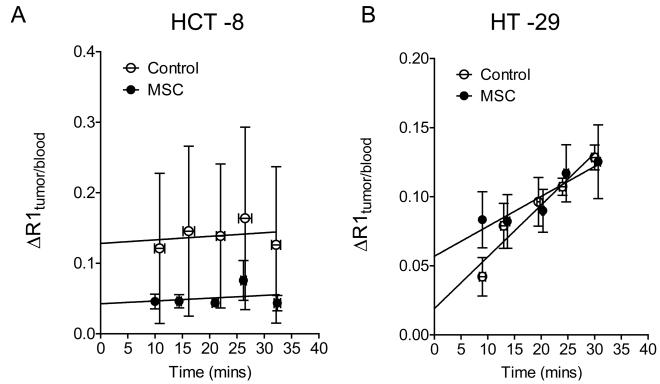
Figure 4.
Vascular response of HCT-8 (A) and HT-29 (B) CRC xenografts to MSC assessed using contrast-enhanced MRI. Relative vascular permeability and vascular volume in control and MSC-treated tumors were calculated from the normalized change in the longitudinal relaxation rate (ΔR1) as described in the Materials and Methods. The sample sizes for the individual groups are as follows: HCT-8: Control (n=6), MSC (n=5) with a P < 0.0001 between intercepts and P > 0.05 between slopes; HT-29: Control (n=4); MSC (n=6) with a P > 0.05 between intercepts and slopes.

