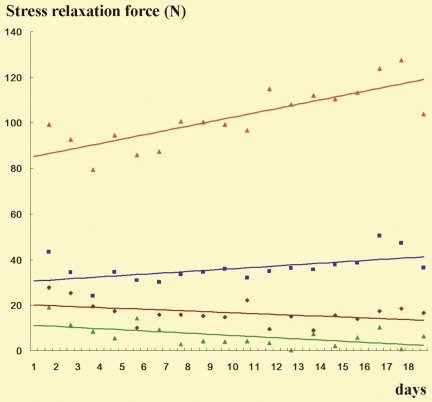
Figure 6.
Stress relaxation at proximal medial site. Color codes, see Figure 5. The stress relaxation value in a day was defined as the difference between the mean of the 960 minimum forces of sine waves in the 2 files collected in the late load period and the mean of the 960 minimum forces in the 2 files collected in the late no-load period. A total 19 values were collected for data in each stem.

