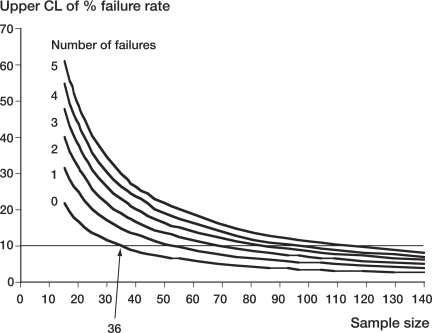
Figure 6.
Variation of the upper confidence limit of the population percentage failure rate with sample size for different numbers of failures in the sample. The horizontal line indicates a 10% threshold of acceptability for the population failure rate. Even if there were no predicted failures in the RSA sample, a minimum sample size of 36 would be required for the upper confidence limit to fall within the 10% threshold. If there was just 1 predicted failure, the sample size would have to be at least 54.

