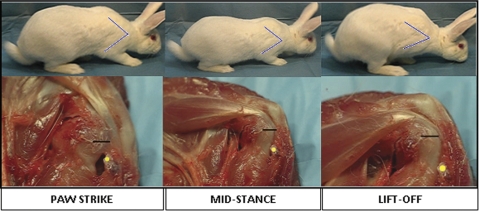
Figure 2.
The top images represent the 3 phases of the right forelimb gait cycle in the rabbit, from paw strike to lift-off. Using video analysis, the scapulohumeral angle was calculated at each phase of the gait cycle. These angles were then translated to the dissected specimen (represented by the blue line on the rabbit forelimb). The lower series of images relates the translated scapulohumeral angle to the dissected specimen. The yellow dot represents the coracoid process and the black line the subscapularis tendon insertion on the humerus. Gross inspection reveals that the tendon has excursion within the tunnel from paw strike to lift-off. This is represented by the increase in distance from the yellow dot (corocoid process) to the black line (subscapularis insertion).

