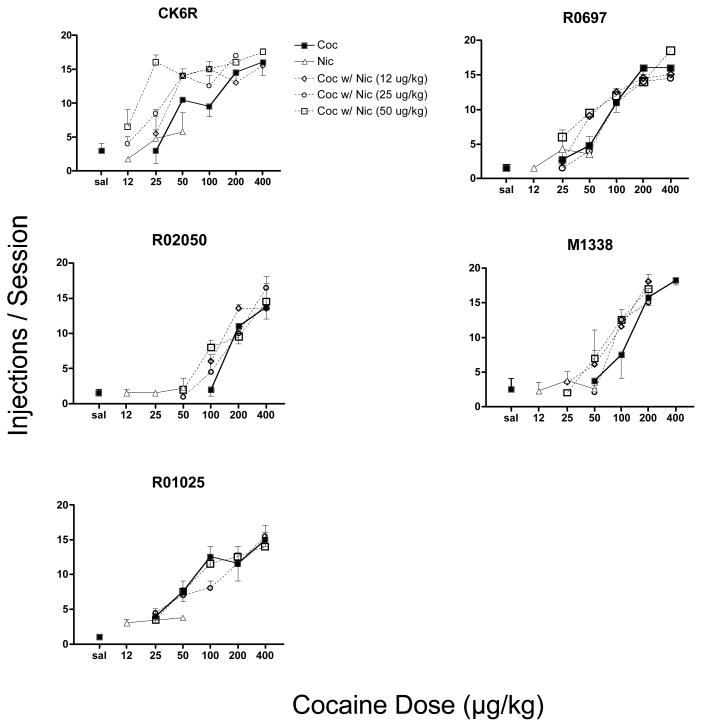
Figure 1.
Dose-response functions for self-administration of cocaine (Coc, bold solid line, squares), nicotine (Nic, thin solid line, triangles), and cocaine mixed with various concentrations of nicotine (hatched lines) under a progressive-ratio schedule of reinforcement. Nicotine concentrations were mixed according to dose per injection. Each point is the mean value for two test sessions at each dose or combination, vertical lines are the range (S.E.M.). Numbers a the top of each graph are the monkey numbers.

