Figure 4.

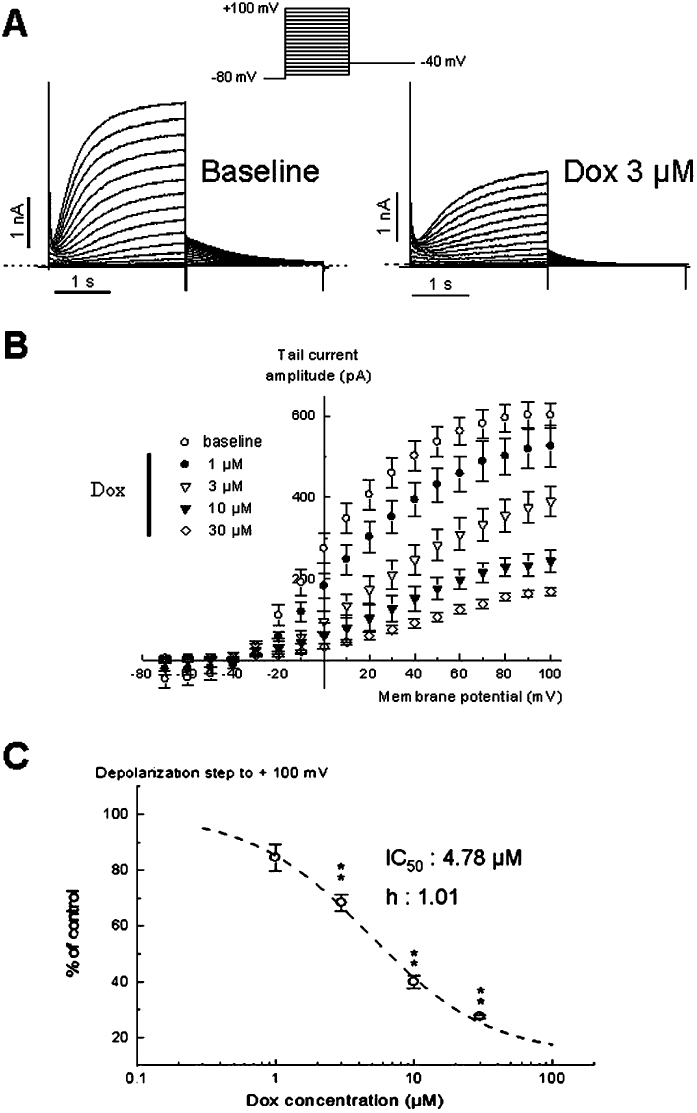
Effect of doxorubicin on IKs current in human embryonic kidney 293 cells. (A) Representative traces illustrating IKs in control and in the presence of 3 µM doxorubicin (Dox). The currents were obtained from the protocol in insert. (B) Tail current amplitude–voltage relationships in control and in the presence of 1, 3, 10 and 30 µM doxorubicin. (C) Concentration–response relationship of IKs inhibition by doxorubicin from 14 cells. The data were fitted with the expression f(x) =[A1 −A2/(1 + (x/IC50)nH)]+ A2, where A1 is the maximal current in control conditions, A2 the current observed at the maximal inhibitory effects of the compound for each concentration and nH (1.01) is the Hill coefficient. From this analysis the IC50 value was 4.78 µM. **P < 0.01 versus baseline (paired Student's t-test).
