
Figure 3.
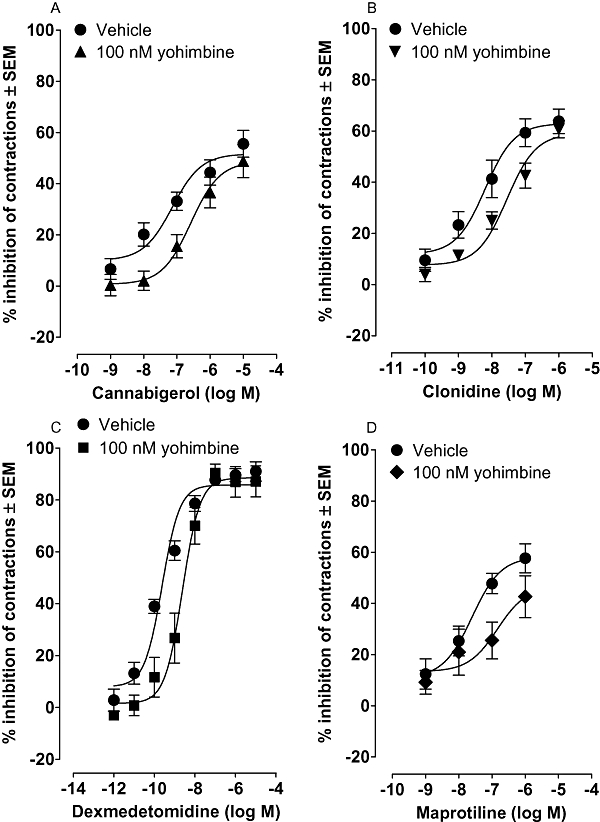
Mean log concentration-response curves of (A) cannabigerol (n= 13), (B) clonidine (n= 7) (C) dexmedetomidine (n= 5) and (D) maprotiline (n= 7) in the MF1 mouse isolated vas deferens constructed in the presence of yohimbine or its vehicle. Each symbol represents the mean value ± SEM for inhibition of electrically evoked contractions expressed as a percentage of the amplitude of the twitch response measured immediately before the first addition of cannabigerol, clonidine or maprotiline to the organ bath. Yohimbine or its vehicle was added 30 min before this first addition and all further additions were made at 5 or 15 min intervals (Methods). Each log concentration response curve was constructed cumulatively. The mean apparent KB value of yohimbine with its 95% confidence limits shown in brackets is 10.1 nM (3.0 and 33.7 nM) against cannabigerol, 14.0 nM (4.9 and 40.6 nM) against clonidine, 8.7 nM (4.3 and 17.8 nM) against dexmedetomidine and 8.2 nM (1.5 and 46.0 nM) against maprotiline. In the absence of yohimbine, electrically evoked contractions were inhibited by cannabigerol, clonidine, dexmedetomidine and maprotiline with mean EC50 values of 72.8 nM (23.4 and 227 nM), 6.3 nM (2.0 and 19.7 nM), 0.24 nM (0.14 and 0.40 nM) and 24.9 nM (5.6 and 111.2 nM) respectively. The 95% confidence limits of these mean values are shown in brackets. The corresponding Emax values are 51.7% (44.3 and 59.1%), 63.0% (54.1 and 71.8%), 85.8% (81.6 and 90.0%) and 58.2% (47.1 and 69.3%) respectively.