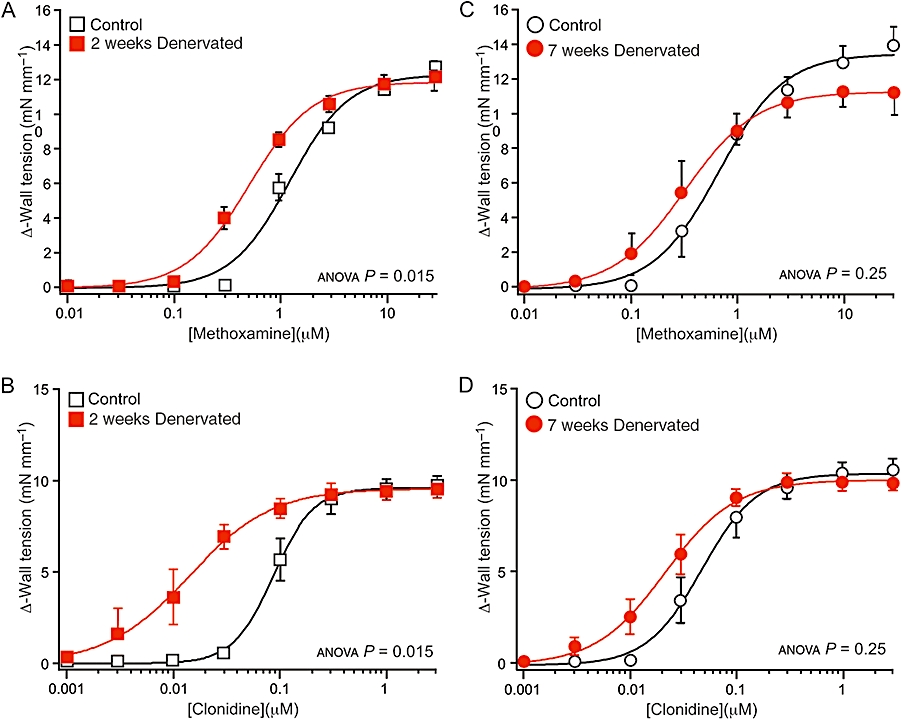
Figure 2.

Effects of denervation on concentration–response curves for the α1-adrenoceptor agonist methoxamine (A,C) and the α2-adrenoceptor agonist clonidine (B,D). (A–D) Data are shown for arteries denervated for (A,B) 2 weeks and (C,D) 7 weeks and their controls (from sham-operated rats). The methoxamine and clonidine concentration–response curves for 2 weeks denervated arteries were shifted to the left of those for their controls, but the concentration–response curves for both drugs in the arteries denervated for 7 weeks did not differ from those of their controls. P values indicate the significance of the differences between the curves for control and denervated arteries (assessed by analysis of variance). For each group of arteries, n= 6.
