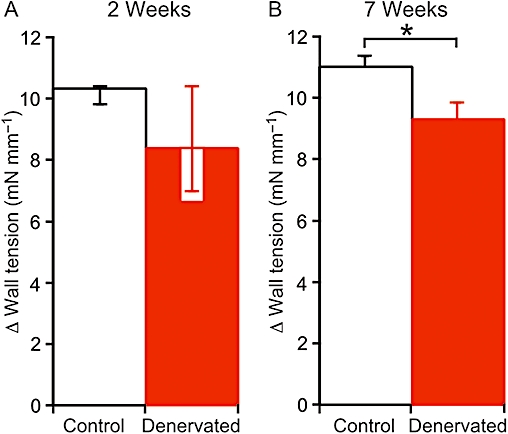
Figure 3.

Effect of denervation on the amplitude of contractions evoked by increasing the K+ concentration to 60 mM. (A,B) Data are shown for arteries denervated for (A) 2 weeks and (B) 7 weeks and their controls (from sham-operated rats). There was no significant difference between control and denervated arteries after 2 weeks, but, after 7 weeks, the K+ evoked contraction of denervated arteries was smaller than that of their controls. Data in (A) are presented as medians and interquartile ranges, and compared using Mann–Whitney U-tests. Data in (B) are presented as means and SEMs, and compared using unpaired t-tests. Significant differences indicated *P < 0.05. For each group of arteries, n= 6.
