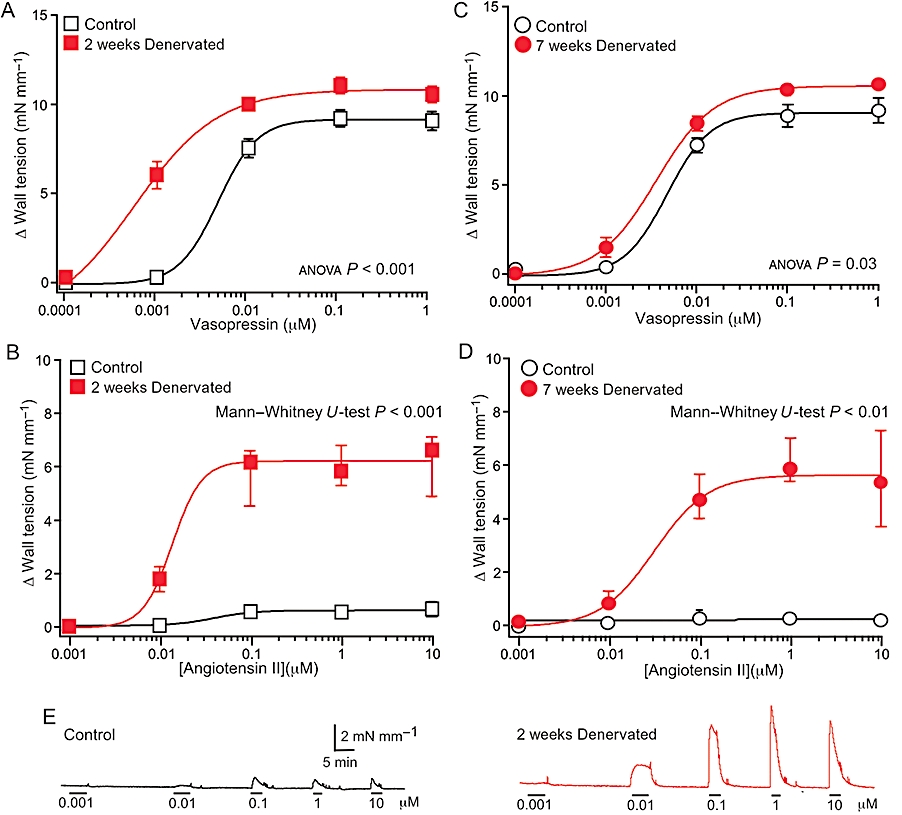
Figure 4.

Effects of denervation on concentration–response curves for the physiological vasoconstrictor agents, vasopressin (A,C) and angiotensin II (AII; B,D). Data are shown for arteries denervated for 2 weeks (A,B), and 7 weeks (C,D) and their controls (from 2 weeks sham-operated and unoperated animals aged-matched to the 7 weeks denervated rats). At both time points, the concentration–response curves for vasopressin in the denervated arteries differed significantly from those of their controls, but the magnitude of this difference was small after 7 weeks. At both time points, the maximum contractions to AII in the denervated arteries were markedly larger than in their controls. (E) Traces showing representative contractions to increasing concentrations of AII in control and 2 weeks denervated arteries. In A and C, data are presented as means ± SEMs, and P values indicate the significance of the differences between the curves for control and denervated arteries (assessed by analysis of variance). In B and D, data are presented as medians and interquartile ranges, and P values indicate the significance of the difference between the maximum contractions to AII (assessed by Mann–Whitney U-tests). For the 2 weeks groups, n= 8, whereas for the 7 weeks groups, n= 6.
