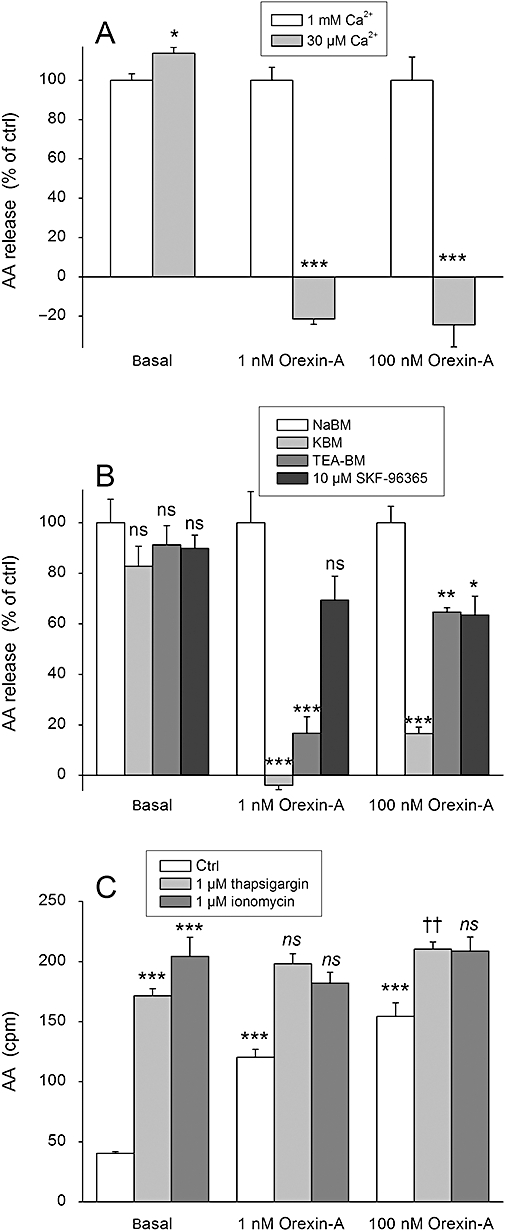
Figure 4.

The effect of Ca2+ on AA release in CHO-hOX1 cells. (A) The cells were stimulated with orexin-A in the normal extracellular concentration of Ca2+ (1 mM) or in the reduced concentration (30 µM) in NaBM. Data are normalized as explained in Data analysis and Figure 3. (B) The cells were, before stimulation with orexin-A, exposed to the treatments that reduce the driving force for Ca2+ entry (KBM) or inhibit particular Ca2+ channel types [TEA-BM (70 mM TEA), SKF-96395 (10 µM) ]. The cells were preincubated for 5 min in the presence of the specific medium/inhibitor before stimulation with orexin-A in the same medium. Data are normalized as explained in Data analysis and Figure 3. (C) The cells were stimulated with orexin-A in the absence (ctrl) or presence of the Ca2+-elevating compounds thapsigargin or ionomycin in NaBM. The first comparison (***) is to the basal (i.e. Do thapsigargin, ionomycin and orexin-A stimulate AA release over the basal?) and the second comparison (†† and ns) to thapsigargin or ionomycin (i.e. Does orexin-A stimulate AA release over thapsigargin or ionomycin?); ns (not significant), P > 0.05; *P < 0.05; **P < 0.01; ***P < 0.001. ††P < 0.01.
