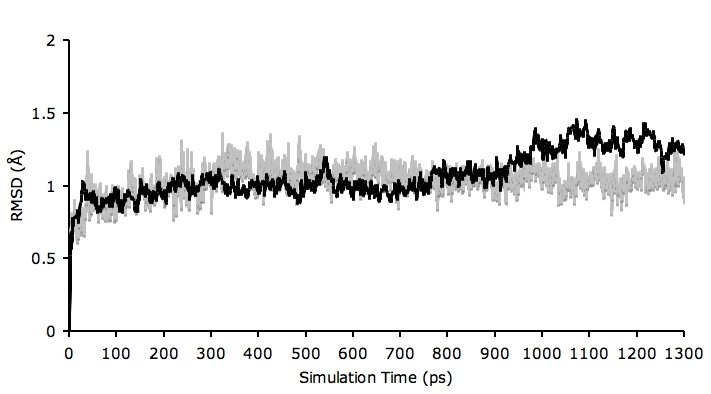
Figure 2.

Plot of root mean square deviation (RMSD) of Cα-TPMT (black) and AdoHcy-6MP complex (gray) trajectories against the initial model. The trajectories were captured every 10 ps until the simulation time reached 1300 ps. The RMSD of both structures are always less than 1.50 Å for the entire simulation indicating high stability of the complex.
