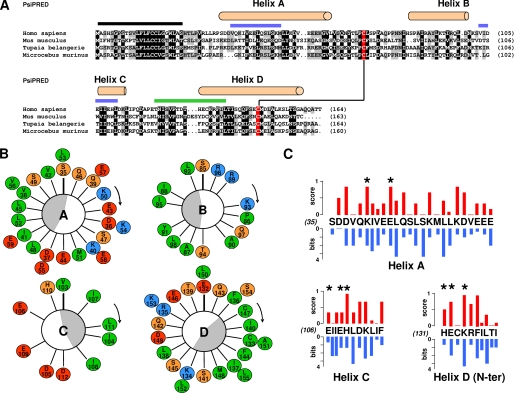
FIGURE 1.
Sequence analysis of IL-31. A, sequence alignment of different IL-31 orthologs selected to be the most divergent. The α-helices predicted by PsiPred are indicated on top of the sequences, and the predicted leader sequence is highlighted by a black line. A disulfide bridge is predicted between two conserved cysteine underlined in red. 100 and 80% conserved or type-conserved residues are highlighted in black and gray, respectively. Sites 2 and 3 are indicated with blue and green lines, respectively, above the alignment. B, Edmundson helical wheel representation of α A, B, C, and D helices. Hydrophobic residues are in green, neutral and hydrophilic amino acids are in orange, positively charged residues are in blue, and negatively charged residues are in red. The amphiphilicities of the α-helices are indicated by gray crescents. C, plot representation of residue conservation scores in blue versus pMUT residue scores in red for amino acid forming α A, C helices, and the N-terminal part of the D helix.

