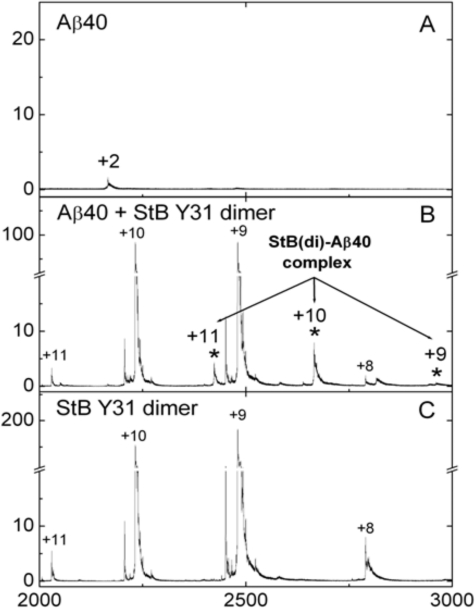
FIGURE 5.
Complex detected by ESI-MS. ESI-MS spectra of Aβ-(1–40), stefin B dimer (Tyr31 variant) and their mixtures were recorded: A, 2 μm Aβ-(1–40); B, a mixture of 2 μm Aβ and 2 μm stefin B; and C, 2 μm stefin B. Peaks corresponding to the Aβ-stefin B complex are denoted with an asterisk and numbers above the peaks denote charge state of the ions.

