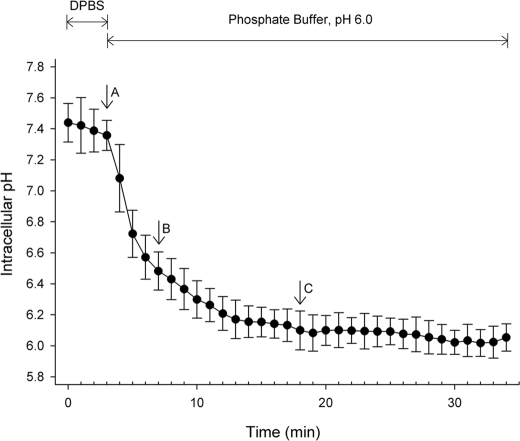
FIGURE 4.
The kinetics of intracellular acidification induced by extracellular acidosis. SNARF-4R-loaded 184 A1N4 cells were maintained in DPBS and then exposed to pH 6.0 buffer. Intracellular pH was recorded and computed as described under “Experimental Procedures.” The pHi value is presented as mean ± S.D. of 10 individual cells at each time point. When maintained in DPBS, the pHi was ∼7.4. After switching to pH 6.0 buffer, the pHi was rapidly decreased. At the indicated time points, matriptase activation was analyzed in two separated experiments by immunoblotting (Fig. 5) and immunofluorescence staining (Fig. 6).

