
FIGURE 4.
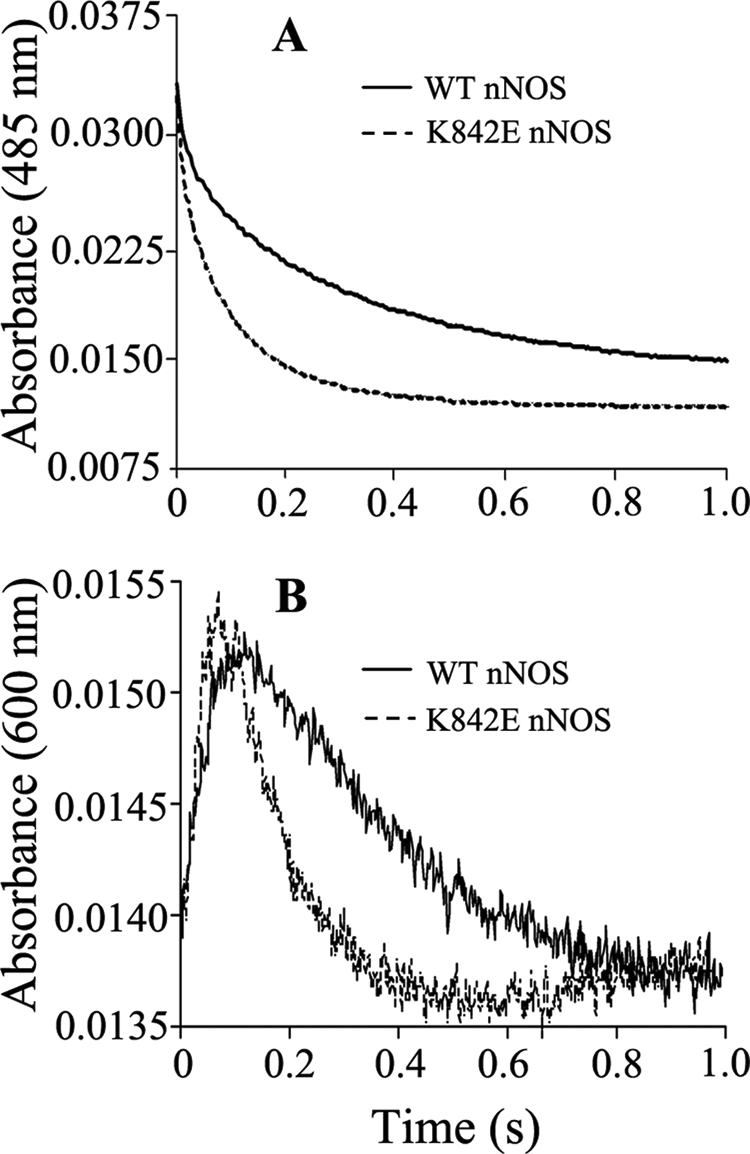
Kinetics of anaerobic flavin reduction in CaM-free WT and K842E nNOS mutant by excess NADPH. Spectral change was recorded at 485 nm (A) and 600 nm (B) in a stopped-flow spectrophotometer after rapidly mixing 5 μm enzyme with a 10-fold excess of NADPH at 10 °C as described under “Experimental Procedures.” The rate constants obtained by fitting these data to biexponential functions. Final concentrations after mixing were as follows: nNOSred enzymes, 2.5 μm; NADPH, 25 μm.