
FIGURE 8.
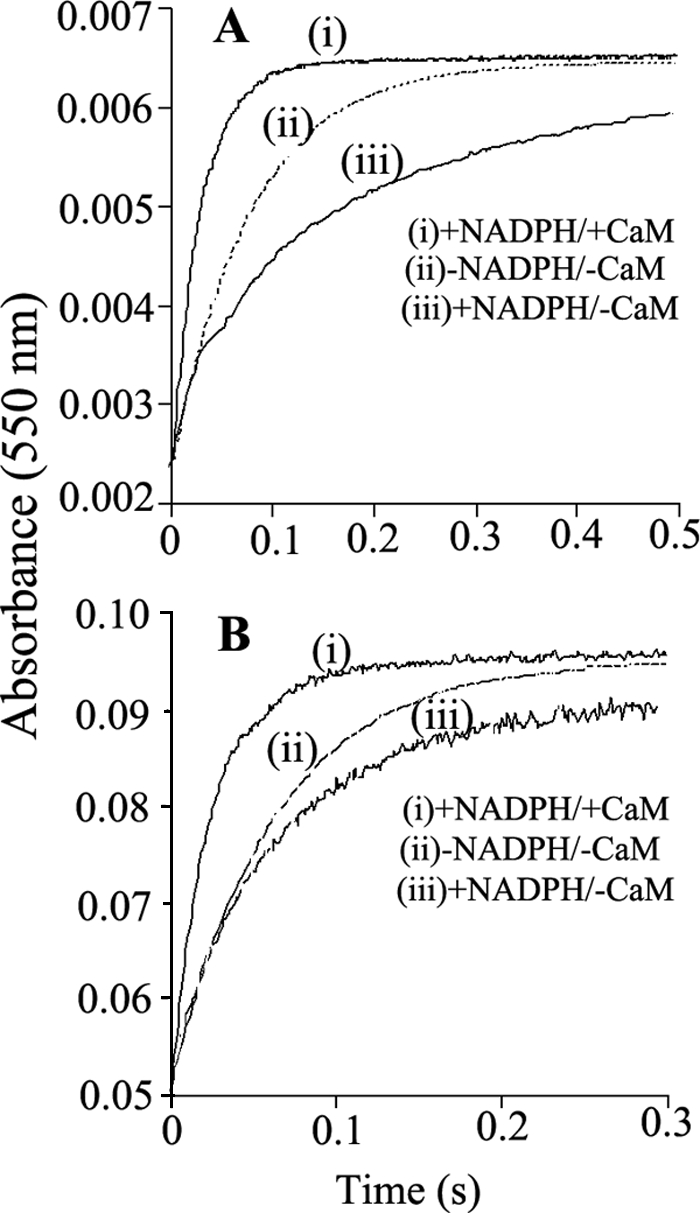
Stopped-flow traces illustrating the NADPH-dependent activation or inhibition of electron transfer to cytochrome c in prereduced WT and K842E nNOSred. Photoreduced samples of WT (A) and K842E (B) nNOSred with and without NADPH and CaM, as indicated, were prepared and rapidly mixed with a substoichiometric amount of cytochrome c in the stopped-flow instrument at 10 °C, as described under “Experimental Procedures” while recording the absorbance increases at 550 nm. Rate constants obtained by fitting these data to single exponential functions are reported in Table 4. The calculated best fit curves to the traces shown here are plotted as dotted lines. The kinetic traces shown are the average calculated from 8–10 mixing experiments each. Final concentrations after mixing were as follows: nNOSred enzymes, 8 μm; cytochrome c, 2 μm.