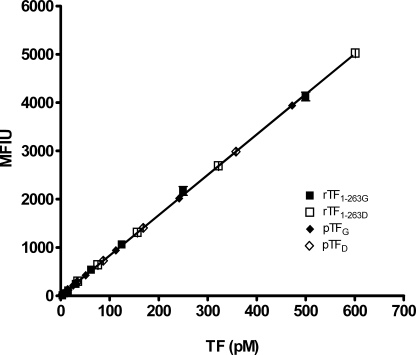
FIGURE 2.
Fluorescence-linked immunoassay of TF proteins. Varying concentrations of rTF1–263G, rTF1–263D, pTFG, and pTFD were captured on anti-TF-5 mAb-coated beads and probed with biotinylated anti-TF-48 mAb and R-phycoerythrin-streptavidine. The immunoassay detects both the G and D forms of TF proteins. Each point is recorded as a mean fluorescence intensity unit (MFIU) and is a mean of two experiments ± 1 S.D.

