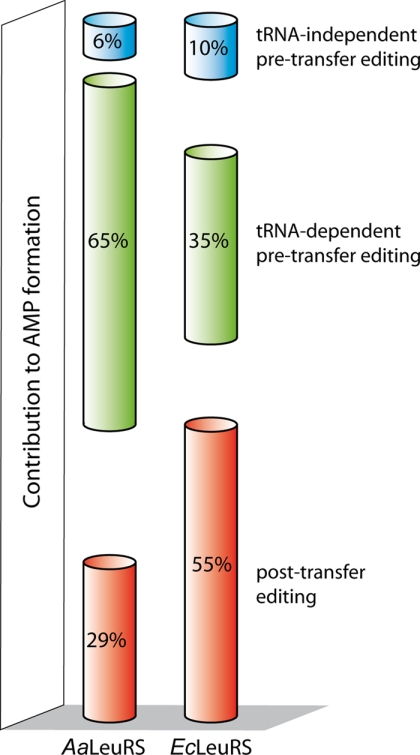
FIGURE 7.
Histogram summarizing the relative contributions of each editing pathway in AMP formation. Percentages were calculated from kobs values of AMP formation reported in Tables 1 and 2. tRNA-independent pre-transfer editing was measured in the absence of tRNA. tRNA-dependent pre-transfer editing was obtained with AaLeuRS-T273R and EcLeuRS-T252R mutants in the presence of tRNA deduced from the tRNA-independent pre-transfer editing contribution. Post-transfer editing was the difference between the native enzymes and the post-transfer defective mutants (or for EcLeuRS in the presence of AN2690), both in the presence of tRNA.

