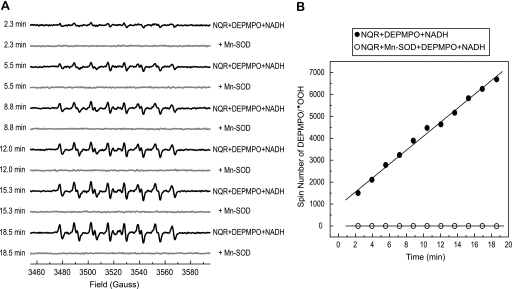
FIGURE 2.
Time dependence of DEPMPO/·OOH formation from the reaction of NQR, DEPMPO, and NADH. A, the components in the system were the same as those described in the legend of Fig. 1A without Mn-SOD or with Mn-SOD addition (1 unit/μl, spectra in gray). The instrumental settings were the same as those described under “Experimental Procedures” except the time of conversion was 81.92 ms and the number of scans was one. B, the spectra (in black) in A were simulated using the parameters of DEPMPO/·OOH. The spin number of each simulated spectrum was calculated based on the area obtained by double integration.

