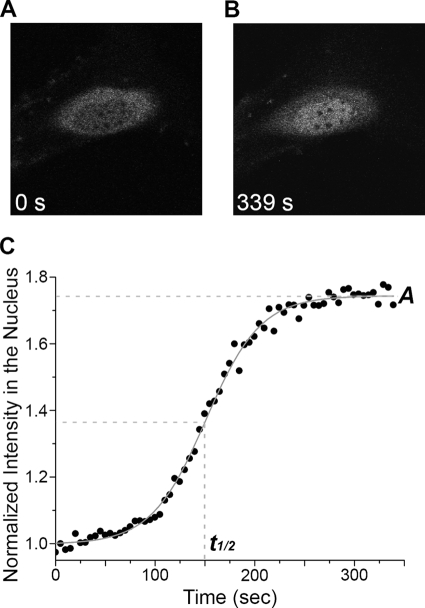
FIGURE 2.
Kinetics of GFP-human ERK1 nuclear accumulation. A, before (0 s) stimulation (cell starved for 12 h), GFP-ERK1-WT (gray) is retained in the cytoplasm and shows the characteristic dark nucleus. B, after stimulation (at 339 s), GFP-ERK1-WT accumulates in the nucleus. C, GFP intensity in the nucleus normalized to initial value as a function of time after serum stimulation. The curves were fit to a sigmoidal function (solid gray line) to extract the half-time to saturation (t½) and the steady-state saturation level (A).

