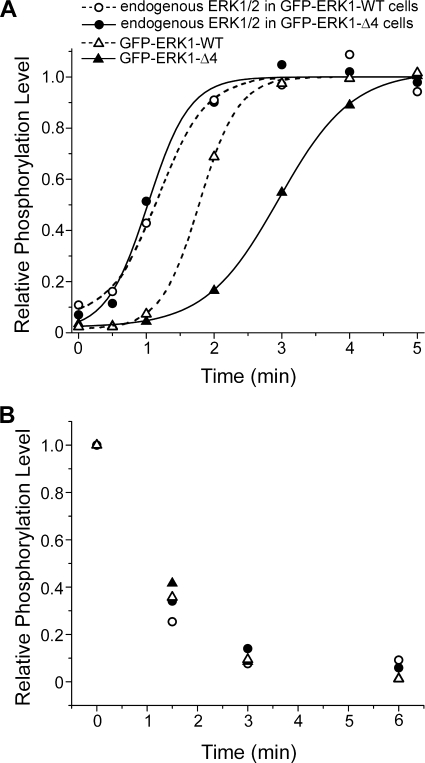
FIGURE 7.
Phosphorylation kinetics were different for ERK1-WT and ERK1-Δ4. A, plot of phosphorylation over time. Solid lines (cells transfected with mutant ERK) and hatched lines (cells transfected with wild type ERK) are sigmoidal fits to the data to determine the t½ values ± 95% confidence interval (see text). Each trace was normalized to the fit maximum. B, relative phosphorylation levels of ERK1 in cells stimulated for 15 min and then treated with PD184359, blocking MEK activation and allowing the dephosphorylation of ERK.

