FIGURE 3.
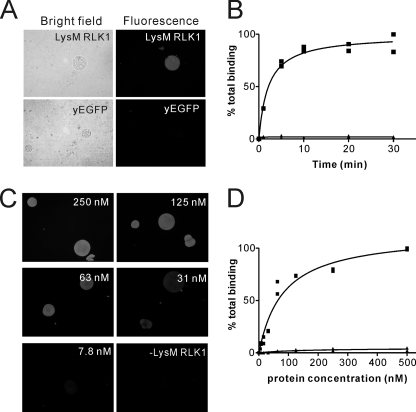
Fluorescence microscopic visualization of the interaction of LysM RLK1 and chitin beads. A, 500 nm LysM RLK1-yEGFP or yEGFP was incubated with chitin beads, and then the interactions of LysM RLK1-yEGFP or yEGFP with chitin beads were observed by the fluorescence microscope. After 20-min incubations, the strong yEGFP fluorescence was observed on the chitin beads incubated with LysM RLK1-yEGFP, but no fluorescence was detected on the beads incubated with yEGFP. B, the time course of the interaction of LysM RLK1-yEGFP and chitin beads was examined. The samples were observed after 1, 5, 10, 20, and 30 min of the incubation. The amount of the proteins bound to chitin beads was analyzed by ImageJ. C and D, the various concentrations of LysM RLK1-yEGFP (3.9, 7.8, 15.6, 31, 63, 125, 250, or 500 nm) were incubated with chitin beads. Only the beads that were incubated without or with 250, 125, 63, 31, or 7.8 nm LysM RLK1-yEGFP are shown (C). The amount of the proteins bound to chitin beads was analyzed by ImageJ (D). ■, LysM RLK1-yEGFP; ▴, yEGFP. These experiments were performed twice with similar results.

