FIGURE 4.
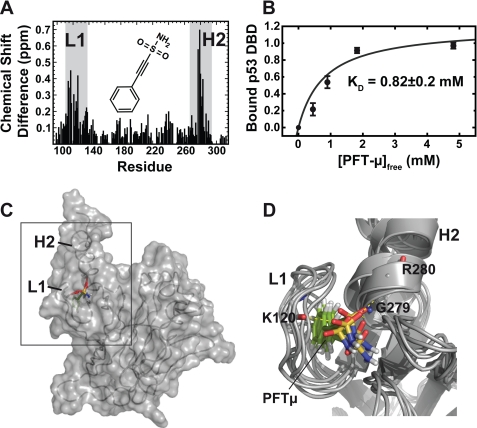
Binding mode of Pifithrin-μ to p53DBD. A, chemical shift perturbation data for the interaction between 300 μm p53DBD and PFTμ measured with 15N-HSQC experiments in 50 mm potassium phosphate, pH 6.8, 50 mm KCl, 5 mm DTT at 293 K. The chemical structure of PFTμ is shown in the inset. Chemical shift differences in the slow exchange regime mostly appear at loop 1 (L1) and helix 2 (H2) (gray boxes). B, titration curve for PFTμ. A KD value of 0.82 mm was obtained by peak volume measurements of the signals corresponding to the free and ligand-bound forms of p53DBD. Five individual residues were used for error estimation. Bars indicate standard error. C, docking result using the chemical shift perturbation data. PFTμ fits into a binding pocket in p53DBD between loop 1 and helix 2. D, overlay of the five best-energy structural models of the complex showing a root mean square deviation of 1.15 Å. The sulfonamide moiety is pointing toward the solvent and forms hydrogen bonds with amide protons of Lys120, Gly279, and Arg280.

