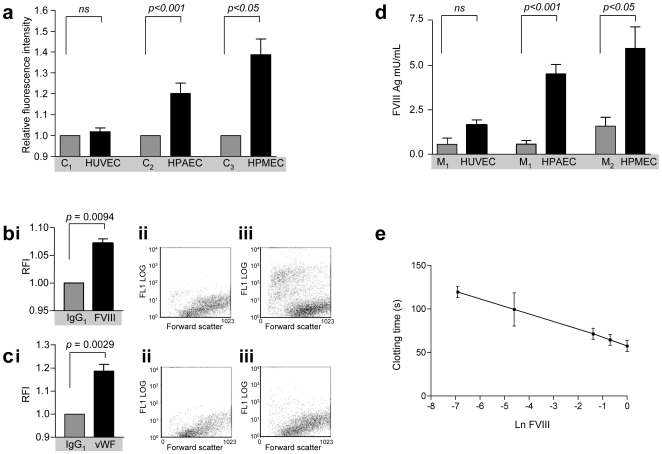
Figure 4. Secreted and cell surface FVIII.
a) Quantification of FVIII on the surface of EC. Relative fluorescence intensity (RFI) of confluent HUVEC, HPAEC and HPMEC stained with FVIII mAb C2, compared to EC from the same well in which C2 was omitted. b) Quantification of HPAEC surface FVIII: bi Comparison of EC RFI for HPAEC from the same well treated with IgG1 control, or C2 mAb; p values calculated by Mann Whitney. bii-iii. Representative raw data plots of log expression (FL1 log) versus forward scatter as a marker of cell size for HPAEC from the same well treated with bii) IgG1 control, biii) C2 mAb. c) Quantification of HPAEC surface vWF. ci) Comparison of EC RFI for HPAEC from the same well treated with IgG1 control, or vWF pAb, p values calculated by Mann Whitney. cii-iii. Representative raw data plots of log expression (FL1 log) versus forward scatter as a marker of cell size for HPAEC from the same well treated with cii) IgG1 control, ciii) vWF pAb. d) Quantification of FVIII:Ag in control and EC-conditioned media by ELISA. M1 denotes control EC media (2% FCS), M2 denotes control MEC media (5% FCS). M1 control data are presented twice for clarity. P values are presented for the 48 hour data sets of EC from passages 4 and 5. Differences at 24 hours did not reach statistical significance. e) Manual FVIII:c assay standard curve. Ln FVIII, logarithm of FVIIIc activity (U/ml). Note clotting time in samples exceeded 240 seconds.

