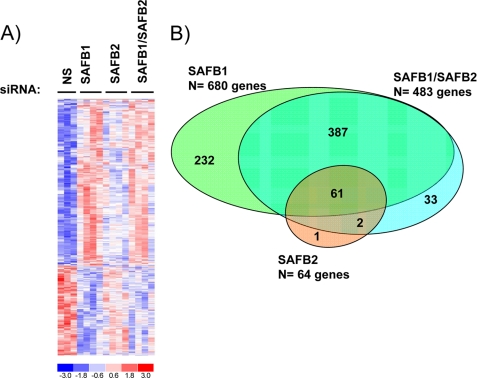
FIGURE 3.
Identification of SAFB1, SAFB2, and SAFB1/SAFB2 target genes in MCF-7 cells. A, heat map representing 716 genes that were significantly regulated by SAFB1, SAFB2, or the combination of SAFB1/SAFB2 siRNA. The cutoff for this analysis was based on a Benjamin-Hochberg adjusted p = 0.1. Expression levels are shown in red and blue (levels are above and below the median, respectively). B, SAFB1 regulates more target genes than SAFB2. The Venn diagram represents genes that are significantly regulated by SAFB1, SAFB2, and SAFB1/SAFB2.

