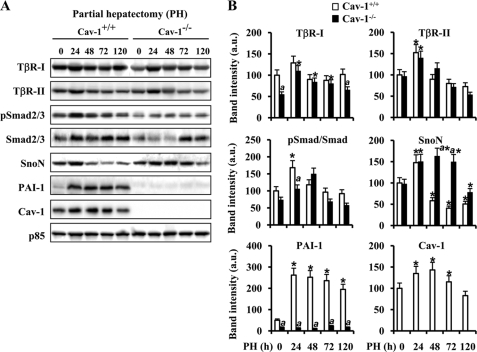
FIGURE 1.
Cav-1 and TGF-β-signaling molecule expression in regenerating liver after PH. Total tissue extracts were prepared from Cav-1+/+ and Cav-1−/− remnant liver after PH at different times. A, protein levels of TβR-I and -II, total and pSmad2/3, Cav-1, SnoN, and PAI-1 were determined by Western blot. Representative blots are shown. B, densitometric analysis of the immunoblots. Data are presented as the means ± S.D. of five independent experiments (animals). *, p < 0.01 versus the corresponding value at 0 time. a, p < 0.01 versus the corresponding value at the indicated time in Cav-1+/+ mice. Blots were normalized with p85 for total extracts.

